Tsunami Detection
by SeaSonde
Tsunami Detection
by SeaSonde
Tsunami Detection
by SeaSonde
SeaSondes See Japan Tsunami on Two Continents
SeaSonde HF radars have been providing real-time data to agencies in several countries on both sides of the Pacific Ocean for more than a decade. This wide distribution made them well placed for detecting the March 2011 tsunami in a variety of locations and configurations. This article highlights several methods, radar frequency bands, and tide gage sensor measurements that all confirm the validity and robustness of SeaSonde tsunami detections.
Tsunami Detected by Multiple HF Bands
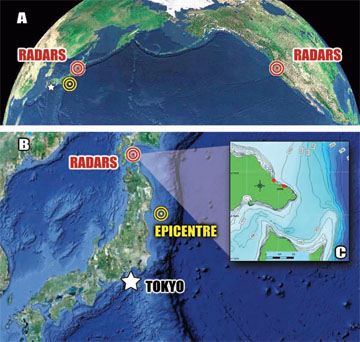
Two High-Res (42 MHz) SeaSondes installed on Hokkaido, northernmost of Japan’s four main islands, were the closest to the earthquake epicenter and the first HF radar systems to observe the tsunami – as shown in the figure on the cover. Being close to the source, the ~40-minute period was clearly visible in the SeaSonde-observed surface current velocity data from both sites. Nine hours later and over 8000 km away, Mid-Range (13 MHz) and Long-Range (5 MHz) SeaSondes on the West Coast of the Continental U.S. were also observing the tsunami signature.
SeaSondes See Japan Tsunami on Two Continents
SeaSonde HF radars have been providing real-time data to agencies in several countries on both sides of the Pacific Ocean for more than a decade. This wide distribution made them well placed for detecting the March 2011 tsunami in a variety of locations and configurations. This article highlights several methods, radar frequency bands, and tide gage sensor measurements that all confirm the validity and robustness of SeaSonde tsunami detections.
Tsunami Detected by Multiple HF Bands
Two High-Res (42 MHz) SeaSondes installed on Hokkaido, northernmost of Japan’s four main islands, were the closest to the earthquake epicenter and the first HF radar systems to observe the tsunami – as shown in the figure on the cover. Being close to the source, the ~40-minute period was clearly visible in the SeaSonde-observed surface current velocity data from both sites. Nine hours later and over 8000 km away, Mid-Range (13 MHz) and Long-Range (5 MHz) SeaSondes on the West Coast of the Continental U.S. were also observing the tsunami signature.
SeaSondes See Japan Tsunami
on
Two Continents
SeaSonde HF radars have been providing real-time data to agencies in several countries on both sides of the Pacific Ocean for more than a decade. This wide distribution made them well placed for detecting the March 2011 tsunami in a variety of locations and configurations. This article highlights several methods, radar frequency bands, and tide gage sensor measurements that all confirm the validity and robustness of SeaSonde tsunami detections.
Tsunami Detected by Multiple HF Bands
Two High-Res (42 MHz) SeaSondes installed on Hokkaido, northernmost of Japan’s four main islands, were the closest to the earthquake epicenter and the first HF radar systems to observe the tsunami – as shown in the figure on the cover. Being close to the source, the ~40-minute period was clearly visible in the SeaSonde-observed surface current velocity data from both sites. Nine hours later and over 8000 km away, Mid-Range (13 MHz) and Long-Range (5 MHz) SeaSondes on the West Coast of the Continental U.S. were also observing the tsunami signature.
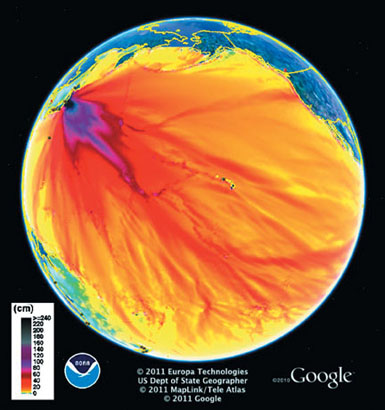
More complexity was observed in the measured periods (25 – 40 min) in the U.S. due to multiple paths and directions of arrival – as illustrated by the NOAA http://nctr.pmel.noaa.gov/ tsunami wave energy map (shown at right). In all cases, the tsunami was observed at three different stages of current velocity processing and by sensors independent from the SeaSondes, as described below.
How do we know for certain we saw the tsunami? Tide gages on the coast give water level and, in the U.S., data from these are made available to the public by NOAA via website. Tide gages are meant to respond to the slowly varying tides with diurnal and semi-diurnal periods, but they see the tsunami signals very well. What do the tide gages tell us?
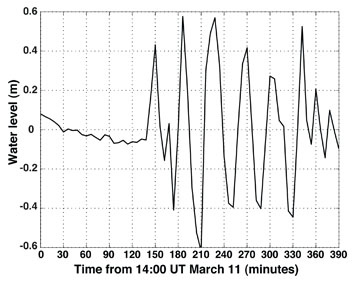
• Both sensors show a slowly varying tidal background until the tsunami arrived, when both observed the more rapid 25-40 minute period response – as shown below.
• Signals at the coast on the tide gages were delayed from those recorded by the radar offshore, from 10 to 30 minutes. The tide gages verified the SeaSondes were, in fact, capturing the tsunami event. One may ask the question why do SeaSondes measure the tsunami before the nearby tide gages do?
• The signals in the current seen by the radars offshore were further “upstream” toward the tsunami source. As it traveled across the ever-shallower water to get to the coast, it slowed down, as predicted by wave theory, over the path distances from 25 – 40 km.
• A quarter-cycle delay happens near shore between velocity and height. If the water starts at normal height and velocity begins to push the mass of water toward shore, it takes time for the height to increase. When the tsunami height reaches its maximum level, velocity must be zero or the height would continue to increase. For ~40 min period, the quarter cycle delay is ~10 minutes.
• The delay seen by the West coast radars and tide gages is about nine and a half hours, which is exactly as predicted for travel time across the Pacific based on both models and observations.
SeaSonde at Commonweal,
25 km Northwest of Golden Gate Bridge
in California
under Golden Gate Bridge
More complexity was observed in the measured periods (25 – 40 min) in the U.S. due to multiple paths and directions of arrival – as illustrated by the NOAA http://nctr.pmel.noaa.gov/ tsunami wave energy map (shown at right). In all cases, the tsunami was observed at three different stages of current velocity processing and by sensors independent from the SeaSondes, as described below.
How do we know for certain we saw the tsunami? Tide gages on the coast give water level and, in the U.S., data from these are made available to the public by NOAA via website. Tide gages are meant to respond to the slowly varying tides with diurnal and semi-diurnal periods, but they see the tsunami signals very well. What do the tide gages tell us?
• Both sensors show a slowly varying tidal background until the tsunami arrived, when both observed the more rapid 25-40 minute period response – as shown below.
• Signals at the coast on the tide gages were delayed from those recorded by the radar offshore, from 10 to 30 minutes. The tide gages verified the SeaSondes were, in fact, capturing the tsunami event. One may ask the question why do SeaSondes measure the tsunami before the nearby tide gages do?
• The signals in the current seen by the radars offshore were further “upstream” toward the tsunami source. As it traveled across the ever-shallower water to get to the coast, it slowed down, as predicted by wave theory, over the path distances from 25 – 40 km.
• A quarter-cycle delay happens near shore between velocity and height. If the water starts at normal height and velocity begins to push the mass of water toward shore, it takes time for the height to increase. When the tsunami height reaches its maximum level, velocity must be zero or the height would continue to increase. For ~40 min period, the quarter cycle delay is ~10 minutes.
• The delay seen by the West coast radars and tide gages is about nine and a half hours, which is exactly as predicted for travel time across the Pacific based on both models and observations.
in California
under Golden Gate Bridge
There is a tradeoff between how often a radar can output information (temporal sampling resolution) and the increment of the observable data (velocity resolution). Since a tsunami is a hazardous event, it is natural to want the highest sampling rate possible. Theory and experience has proven, however, that if the velocity sampling is too coarse, it is of little or no value. For any 13 MHz radar regardless of its make or brand, a 30-second output means the best possible velocity resolution is 38 cm/s. This is nearly useless, because the tsunami generated currents seen by all of the radars had crest/trough values more like 10-20 cm/s. Using 4 minute outputs gives about 3.5 cm/s resolution, which does a nice job. With this sampling rate, 10 samples were available per tsunami period, which is more than adequate. The CODAR tsunami detection approach does not force any fixed sampling rate. Instead, several output rates (velocity resolutions) are computed simultaneously to maximize the possibility of detection and it has zero impact on standard current processing operations.
In addition to sampling rate, observation time before the tsunami reaches shore depends on water depth — the shallower and longer the shelf, the greater the time to reach shore. Unlike the Mid-Atlantic states along the Eastern seaboard, both Japan and the U.S. West coast are not optimal with narrow shelves of shallow water. Yet, the tsunami was seen in all cases at distances to 20 km and water depths to 200 m.
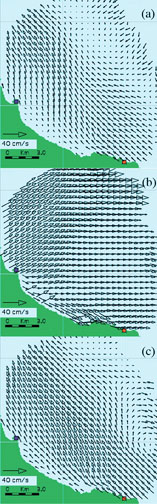
The HF radar output with which everyone is familiar are current vector maps requiring two or more coastal radars combining data. 2-D velocity fields show the onset of tsunami-generated currents is in figure at left. This method has the advantage of producing a nice image of the currents that is easily interpreted visually, but requires data to be transmitted between two or more sites and extra processing time. It is most useful for post-processing and analysis, but not real-time tsunami detection.
• Radial Velocity Maps
Radial velocity currents from a single site provide robust data for tsunami detection and are the basis of CODAR SeaSonde Tsunami Software. Certainly the individual vectors can be post-processed to observe tsunami effects. More useful to quickly detect the onset of a tsunami is the CODAR tsunami detection pattern recognition software, which resolves the radial velocities sensed by a single radar into strips parallel to the bathymetry contours. Physics forces the velocity vectors to be essentially perpendicular to these contours, regardless of the direction of the epicenter source. Indeed, velocities resolved in this manner show the tsunami period, and also the variation with distance offshore that is expected.
• Doppler Sea Echo
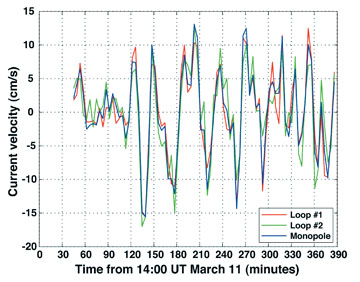
Stepping back even further in the processing stream (before the direction finding method is applied and radial velocity maps are made), we looked at the variation in the width and centroid of the Doppler sea echo with time as a direct measure of the overall tsunami current. The results of this are illustrated in the time series figures shown above. This stage of processing is even faster to reach than radial maps and is the focus of future improvements to CODAR SeaSonde tsunami detection.
HF Radar Tsunami Detection First Described by CODAR
It was over 32 years ago that Barrick first described how an approaching tsunami could be measured from its HF radar-observed current pattern in a 1979 Remote Sensing of Environment article. With few HF radars operating at that time and sizable tsunamis being a rare or infrequent occurrence, this research went largely unnoticed for many years. Following the 2004 Indian Ocean tsunami, Lipa and Barrick revisited the topic by developing a tsunami pattern recognition algorithm that worked against the ambient background flows. The methods described in their 2006 paper formed the basis for the first and only commercial HF radar tsunami detection software package available on the market.
The HF radar output with which everyone is familiar are current vector maps requiring two or more coastal radars combining data. 2-D velocity fields show the onset of tsunami-generated currents is in figure at left. This method has the advantage of producing a nice image of the currents that is easily interpreted visually, but requires data to be transmitted between two or more sites and extra processing time. It is most useful for post-processing and analysis, but not real-time tsunami detection.
• Radial Velocity Maps
Radial velocity currents from a single site provide robust data for tsunami detection and are the basis of CODAR SeaSonde Tsunami Software. Certainly the individual vectors can be post-processed to observe tsunami effects. More useful to quickly detect the onset of a tsunami is the CODAR tsunami detection pattern recognition software, which resolves the radial velocities sensed by a single radar into strips parallel to the bathymetry contours. Physics forces the velocity vectors to be essentially perpendicular to these contours, regardless of the direction of the epicenter source. Indeed, velocities resolved in this manner show the tsunami period, and also the variation with distance offshore that is expected.
• Doppler Sea Echo
Stepping back even further in the processing stream (before the direction finding method is applied and radial velocity maps are made), we looked at the variation in the width and centroid of the Doppler sea echo with time as a direct measure of the overall tsunami current. The results of this are illustrated in the time series figures shown above. This stage of processing is even faster to reach than radial maps and is the focus of future improvements to CODAR SeaSonde tsunami detection.
HF Radar Tsunami Detection First Described by CODAR
It was over 32 years ago that Barrick first described how an approaching tsunami could be measured from its HF radar-observed current pattern in a 1979 Remote Sensing of Environment article. With few HF radars operating at that time and sizable tsunamis being a rare or infrequent occurrence, this research went largely unnoticed for many years. Following the 2004 Indian Ocean tsunami, Lipa and Barrick revisited the topic by developing a tsunami pattern recognition algorithm that worked against the ambient background flows. The methods described in their 2006 paper formed the basis for the first and only commercial HF radar tsunami detection software package available on the market.